NeuroMap® Vision
Predict where the eye goes, then score the visual against The Persuasion Code — the six stimuli that persuade the primal brain. Upload an ad, landing page, or package design to get an attention heatmap, gaze plot, areas of interest, and concrete fixes.
What you'll get
- 🔥 An attention heatmap & gaze plot (where the eye lands first)
- 🎯 Ranked areas of interest
- 🧠 A Persuasion Score across the six NeuroMap® stimuli
- ✅ Grabbers, attention leaks, CTA check, and prioritized fixes
NeuroTest Report
Sample — Apple “Data Auction” (1:24)
78
NeuroMap® Score
B+ · Persuaded quadrant
78
Primal engagement
Capture
77
Rational engagement
Convince + close
72
Visual attention
Approach positive
Attention layer
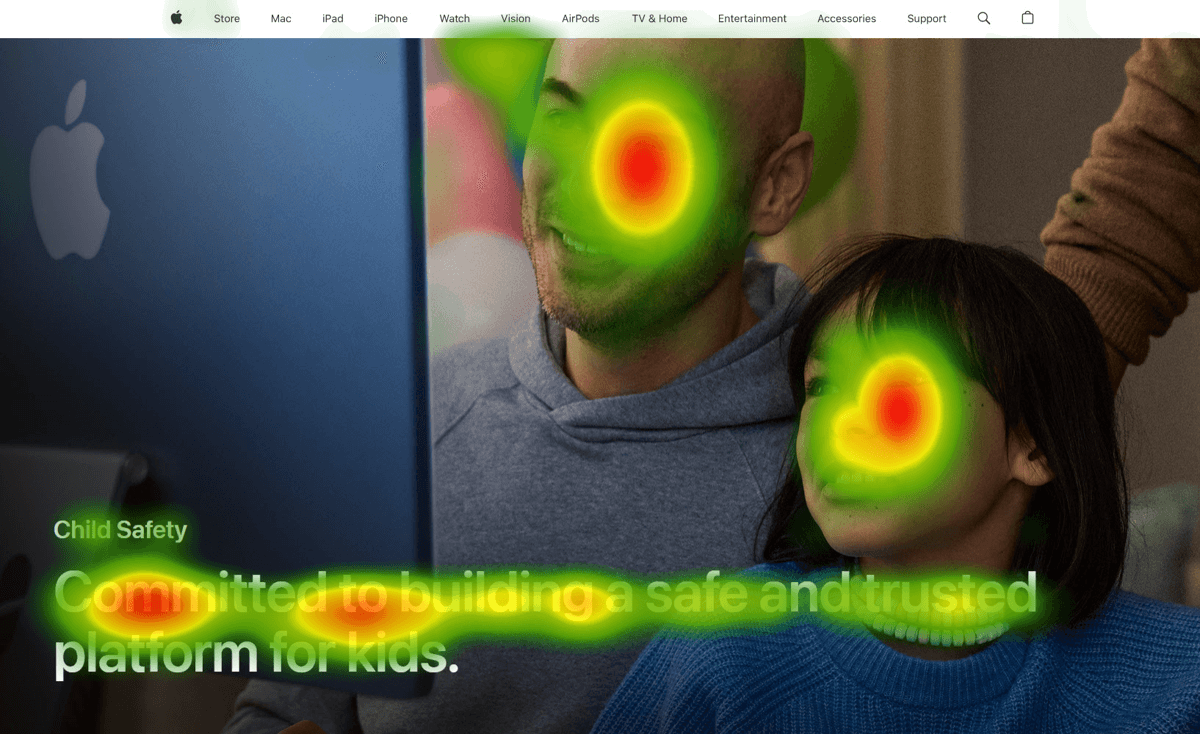
Attention heat map
Red zones = highest predicted attention
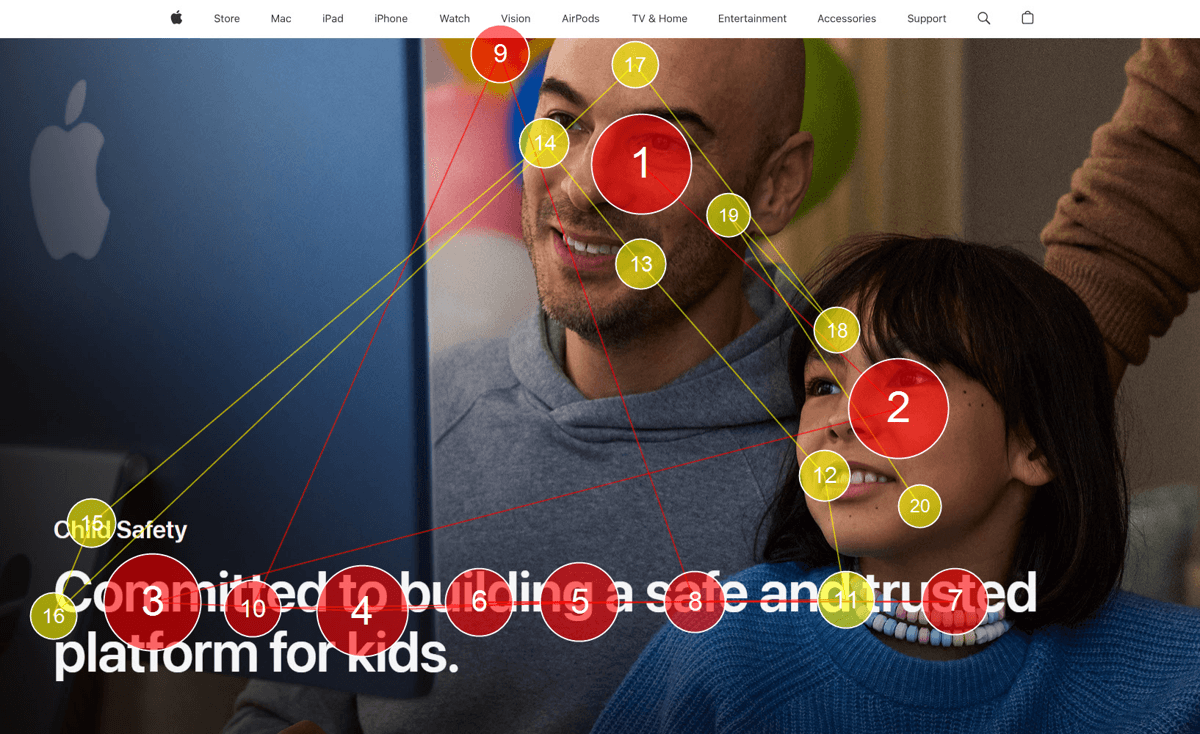
Gaze journey
Numbered fixations, in order

Facial expression AI
Emotional valence per face
Full analysis
What works
Faces act as instant attention magnets, handing the gaze straight to the headline — the claim is reached almost immediately.
What doesn’t
A key label reached at ~3.7 seconds with only 20% visibility. If it matters, it needs contrast and repositioning.
AOI analysis — element by element
Visibility %, first-fixation time and dwell for every region you care about.
Critical scenes — peaks & valleys
Every peak and valley mapped to the exact scene that drives it.
Voiceover & copy analysis
Claim quality, positioning and the words that carry — or lose — the primal brain.
Prioritized recommendations
Ranked fixes — what to change first, and the gain you should expect.
Scores and the attention layer are shown. The narrative analysis, AOI tables and ranked recommendations are delivered in the full NeuroTest Report.
Shown for demonstration purposes only. Apple® and the “Data Auction” advertisement are the property of Apple Inc. All third-party trademarks, product names, and creative remain the property of their respective owners. This example is used solely to illustrate neuromarketing analysis methodology and does not imply any affiliation with, sponsorship by, or endorsement from Apple Inc. or any other rights holder.
This is a preview
You just saw the attention layer. The full report goes further.
NeuroMap® Testing Services tests images, GIFs, and video up to two minutes — measuring not only where the eye goes, but what the viewer feels, how hard the brain works, and whether your claim ever lands. Every asset returns as a complete NeuroMap® Testing Report.
The deliverable — what you receive
Attention heat maps
Red zones = highest predicted attention
Opacity / fog maps
What stays visible is all viewers truly see
Gaze journeys
Numbered fixations, in the order the eye travels
AOI visibility percentages
Element by element — visibility and first-fixation time
Emotional valence findings
Facial expression AI — approach vs. withdraw
Video peaks & scene grades
Attention and emotion across the full timeline
What works / what doesn’t
Every finding comes with a verdict
Prioritized recommendations
Ranked fixes, not a list of observations
Optional: a before/after retest quantifies the measurable improvement your redesign delivers.
The process — fast, confidential, rigorous
- 1
Submit
Send assets — or we capture them from your live site.
- 2
Analyze
Predictive analysis runs — results in minutes to days.
- 3
Score
AOI definition and scoring around your priorities.
- 4
Report
Findings and recommendations presented by Dr. Morin’s team.
- 5
Validate
Optional redesign support and retest to prove the gain.
All materials remain strictly confidential and are never used beyond your engagement.
Stop guessing what your customers see. Know it.
Test the assets that matter most to your next campaign — images, GIFs, or video — and review the findings with Dr. Morin’s team.